
Coaching Suite
Training load (ACWR)
Training Load turns the workouts you log into an objective picture of how much work each athlete and group is doing — and flags when that work is ramping up faster than the body can adapt.
What it is
Every workout item with a distance contributes a load score (volume × intensity). QuickMeet totals those scores per day, then computes the Acute:Chronic Workload Ratio (ACWR) — recent load (about 7 days) compared to baseline load (about 28 days) — and sorts each athlete and group into a color-coded risk zone.
Where the numbers come from
Open Training Load
- 1
Go to Coaching → Training Load
In the sidebar, under Coaching, choose Training Load.
- 2
Read the group summary
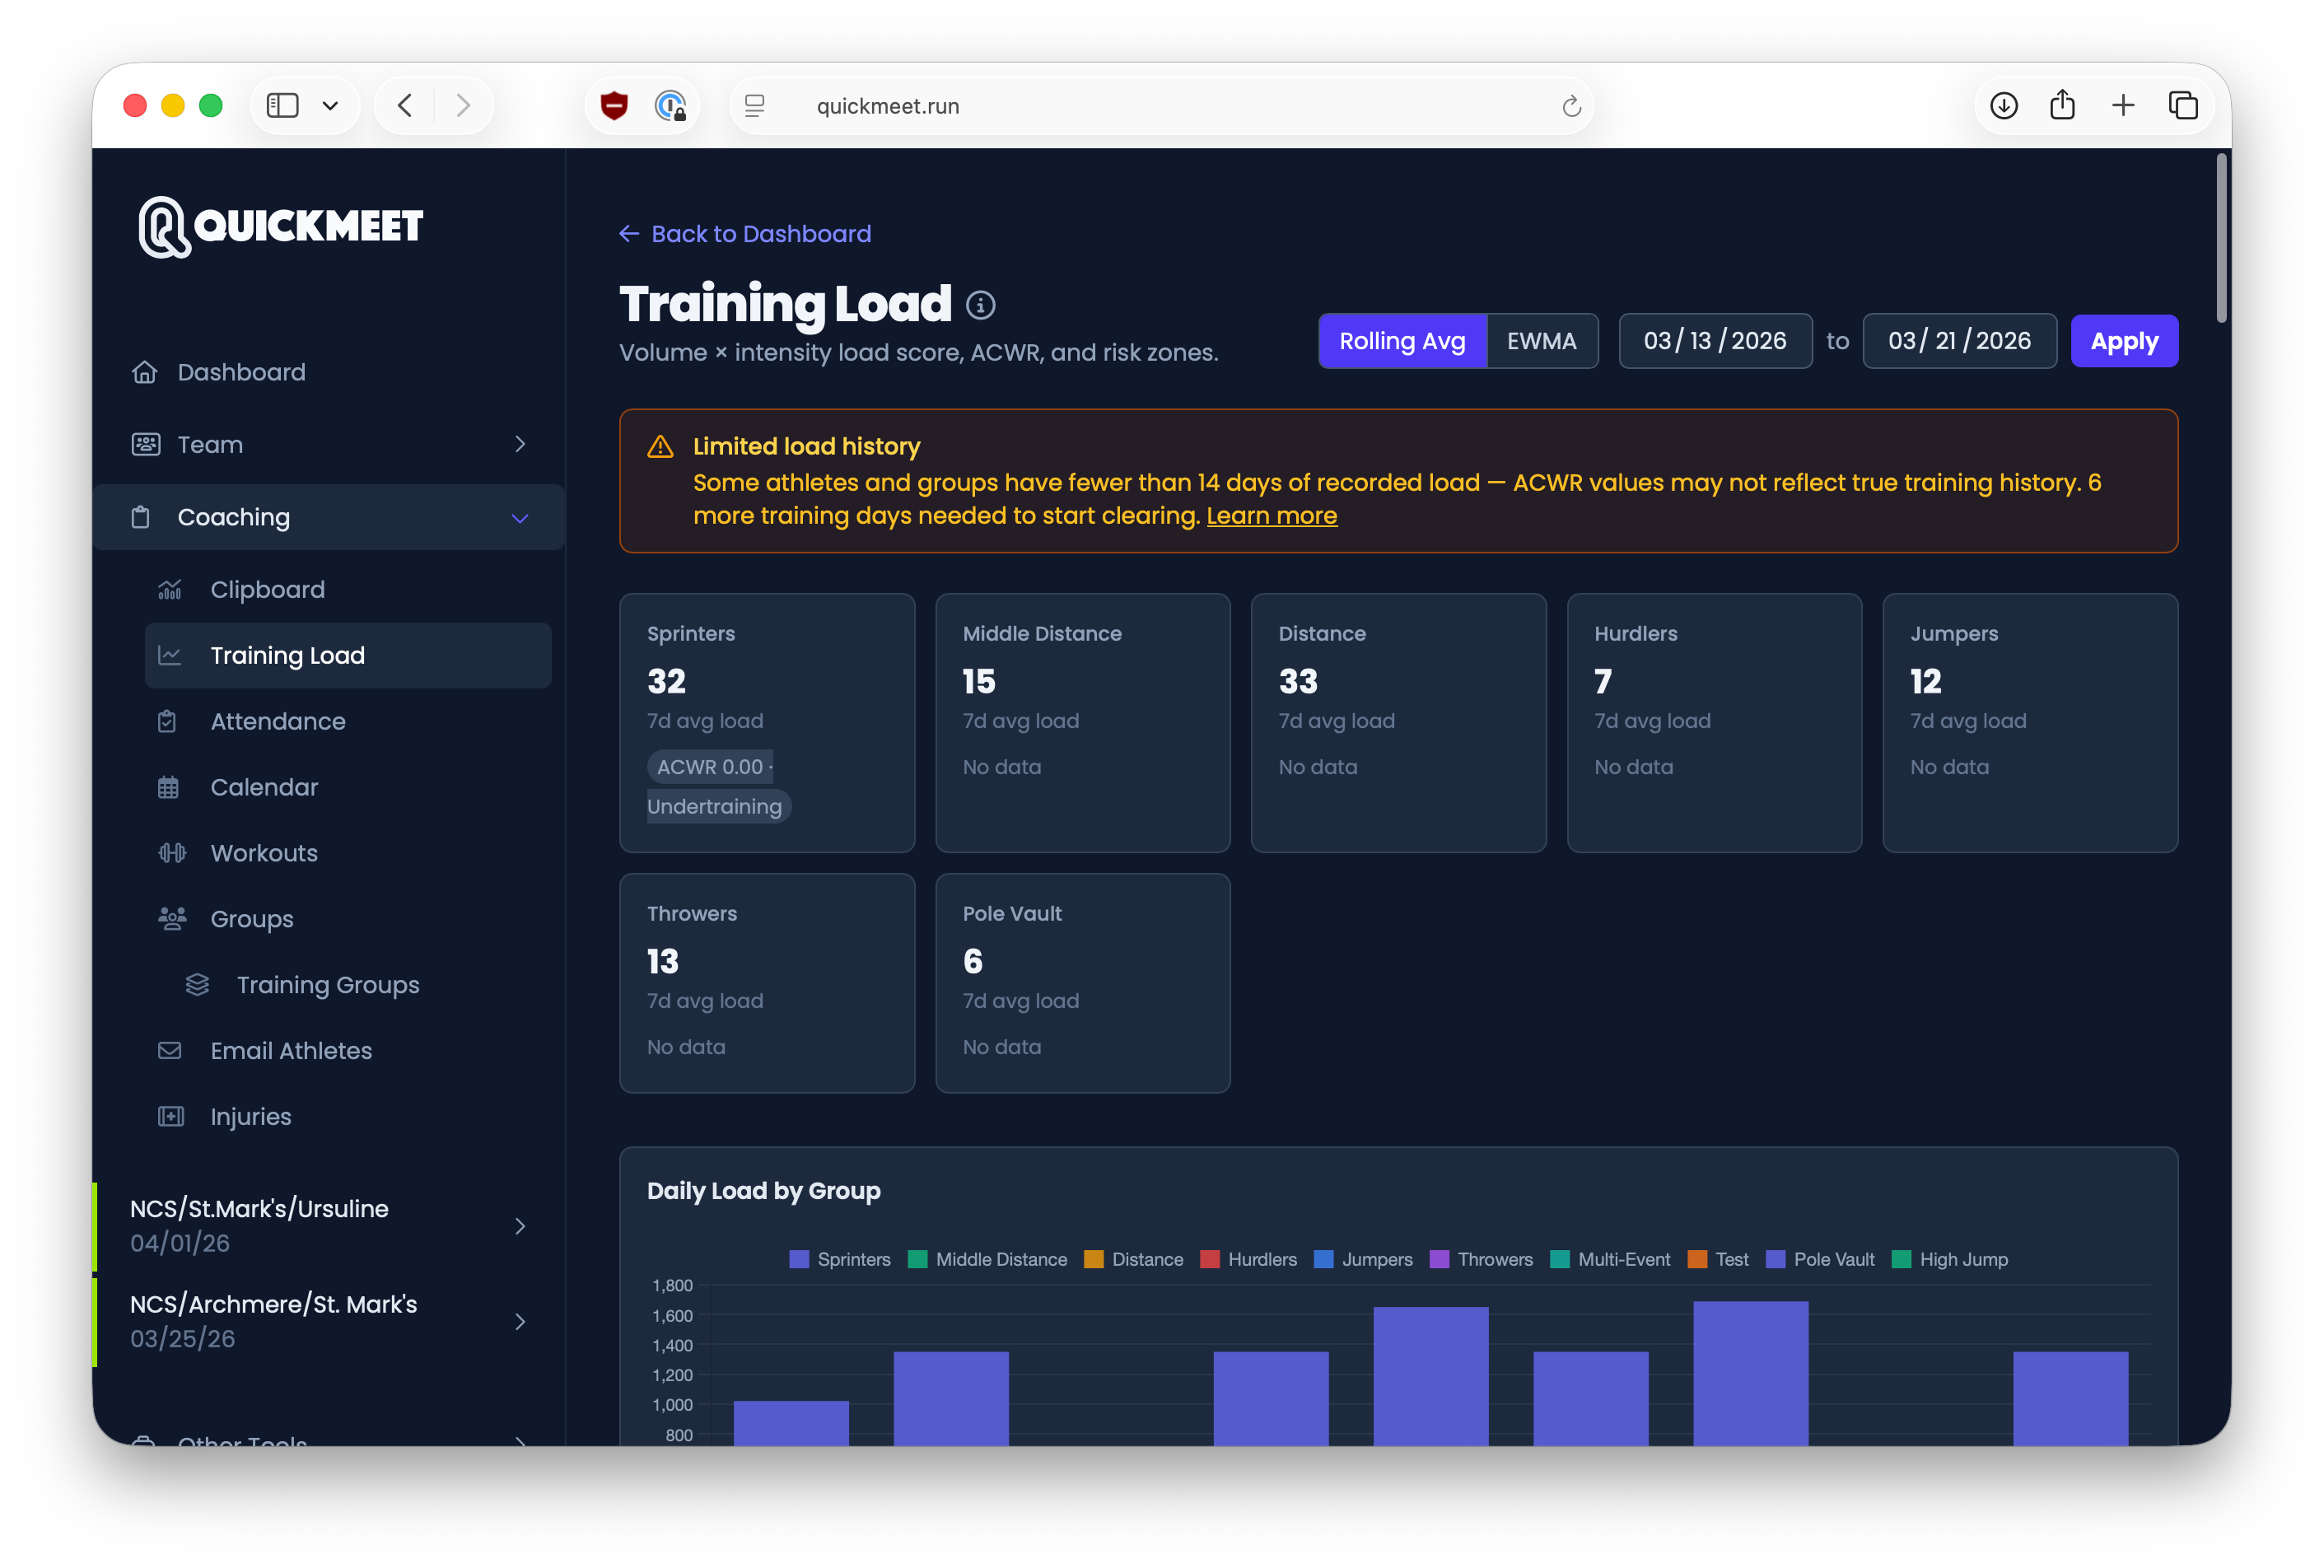
The cards at the top show each group's recent load and its ACWR with a risk badge — a fast, at-a-glance read on which groups are in a healthy range and which are climbing.
- 3
Scan the daily load chart
The Daily Load by Groupchart stacks each group's load per day across your selected date range, so you can see the shape of the training block — build weeks, taper, and spikes.
- 4
Review the athlete table
Below the chart, every active athlete is listed with their acute load, chronic load, ACWR, and risk zone — so you can catch individuals trending into caution even when their group looks fine.
Reading the risk zones
ACWR is grouped into four zones:
- Undertraining (below 0.8) — recent load is well under baseline; fitness may be slipping.
- Optimal (0.8–1.3) — the healthy sweet spot, with the lowest injury risk.
- Caution (1.3–1.5) — ramping faster than the body is adapting; ease off or hold steady.
- High risk (above 1.5) — a sharp load spike and elevated injury risk.
Switching models & date range
Two controls at the top let you tailor the view:
- Rolling Avg vs EWMA — Rolling uses simple 7- and 28-day averages; EWMA weights recent days more heavily and is common in sports science. Toggle between them to compare.
- Date range — set the start and end dates to focus the chart and athlete table on a specific block (a build phase, a championship taper, and so on).
"Limited load history" early in a season
ACWR needs about 14 days of recorded load to be meaningful. If an athlete or group has less than that, you'll see a low-data notice — the numbers are directional until more workouts are logged. This is normal at the start of a season and clears as you log training.
Getting the most from it
- Log workouts consistently — training load is only as complete as the workouts you record.
- Set effort/intensity on workout items so load reflects hard days vs. easy days, not just distance.
- Check it weekly when planning, and again before championship tapers, to keep athletes in the optimal zone.
Related: Workouts, Workout calendar, Injuries.