
July 10, 2026
WTF: Training Load Calculator
Happy Friday!
I've been working on adding documentation to QuickMeet over the past few weeks. It's not 100% complete yet, but I've been making good progress. If you wondered how things work, stop by https://quickmeet.run/docs.
Today's WTF is all about Training Load.
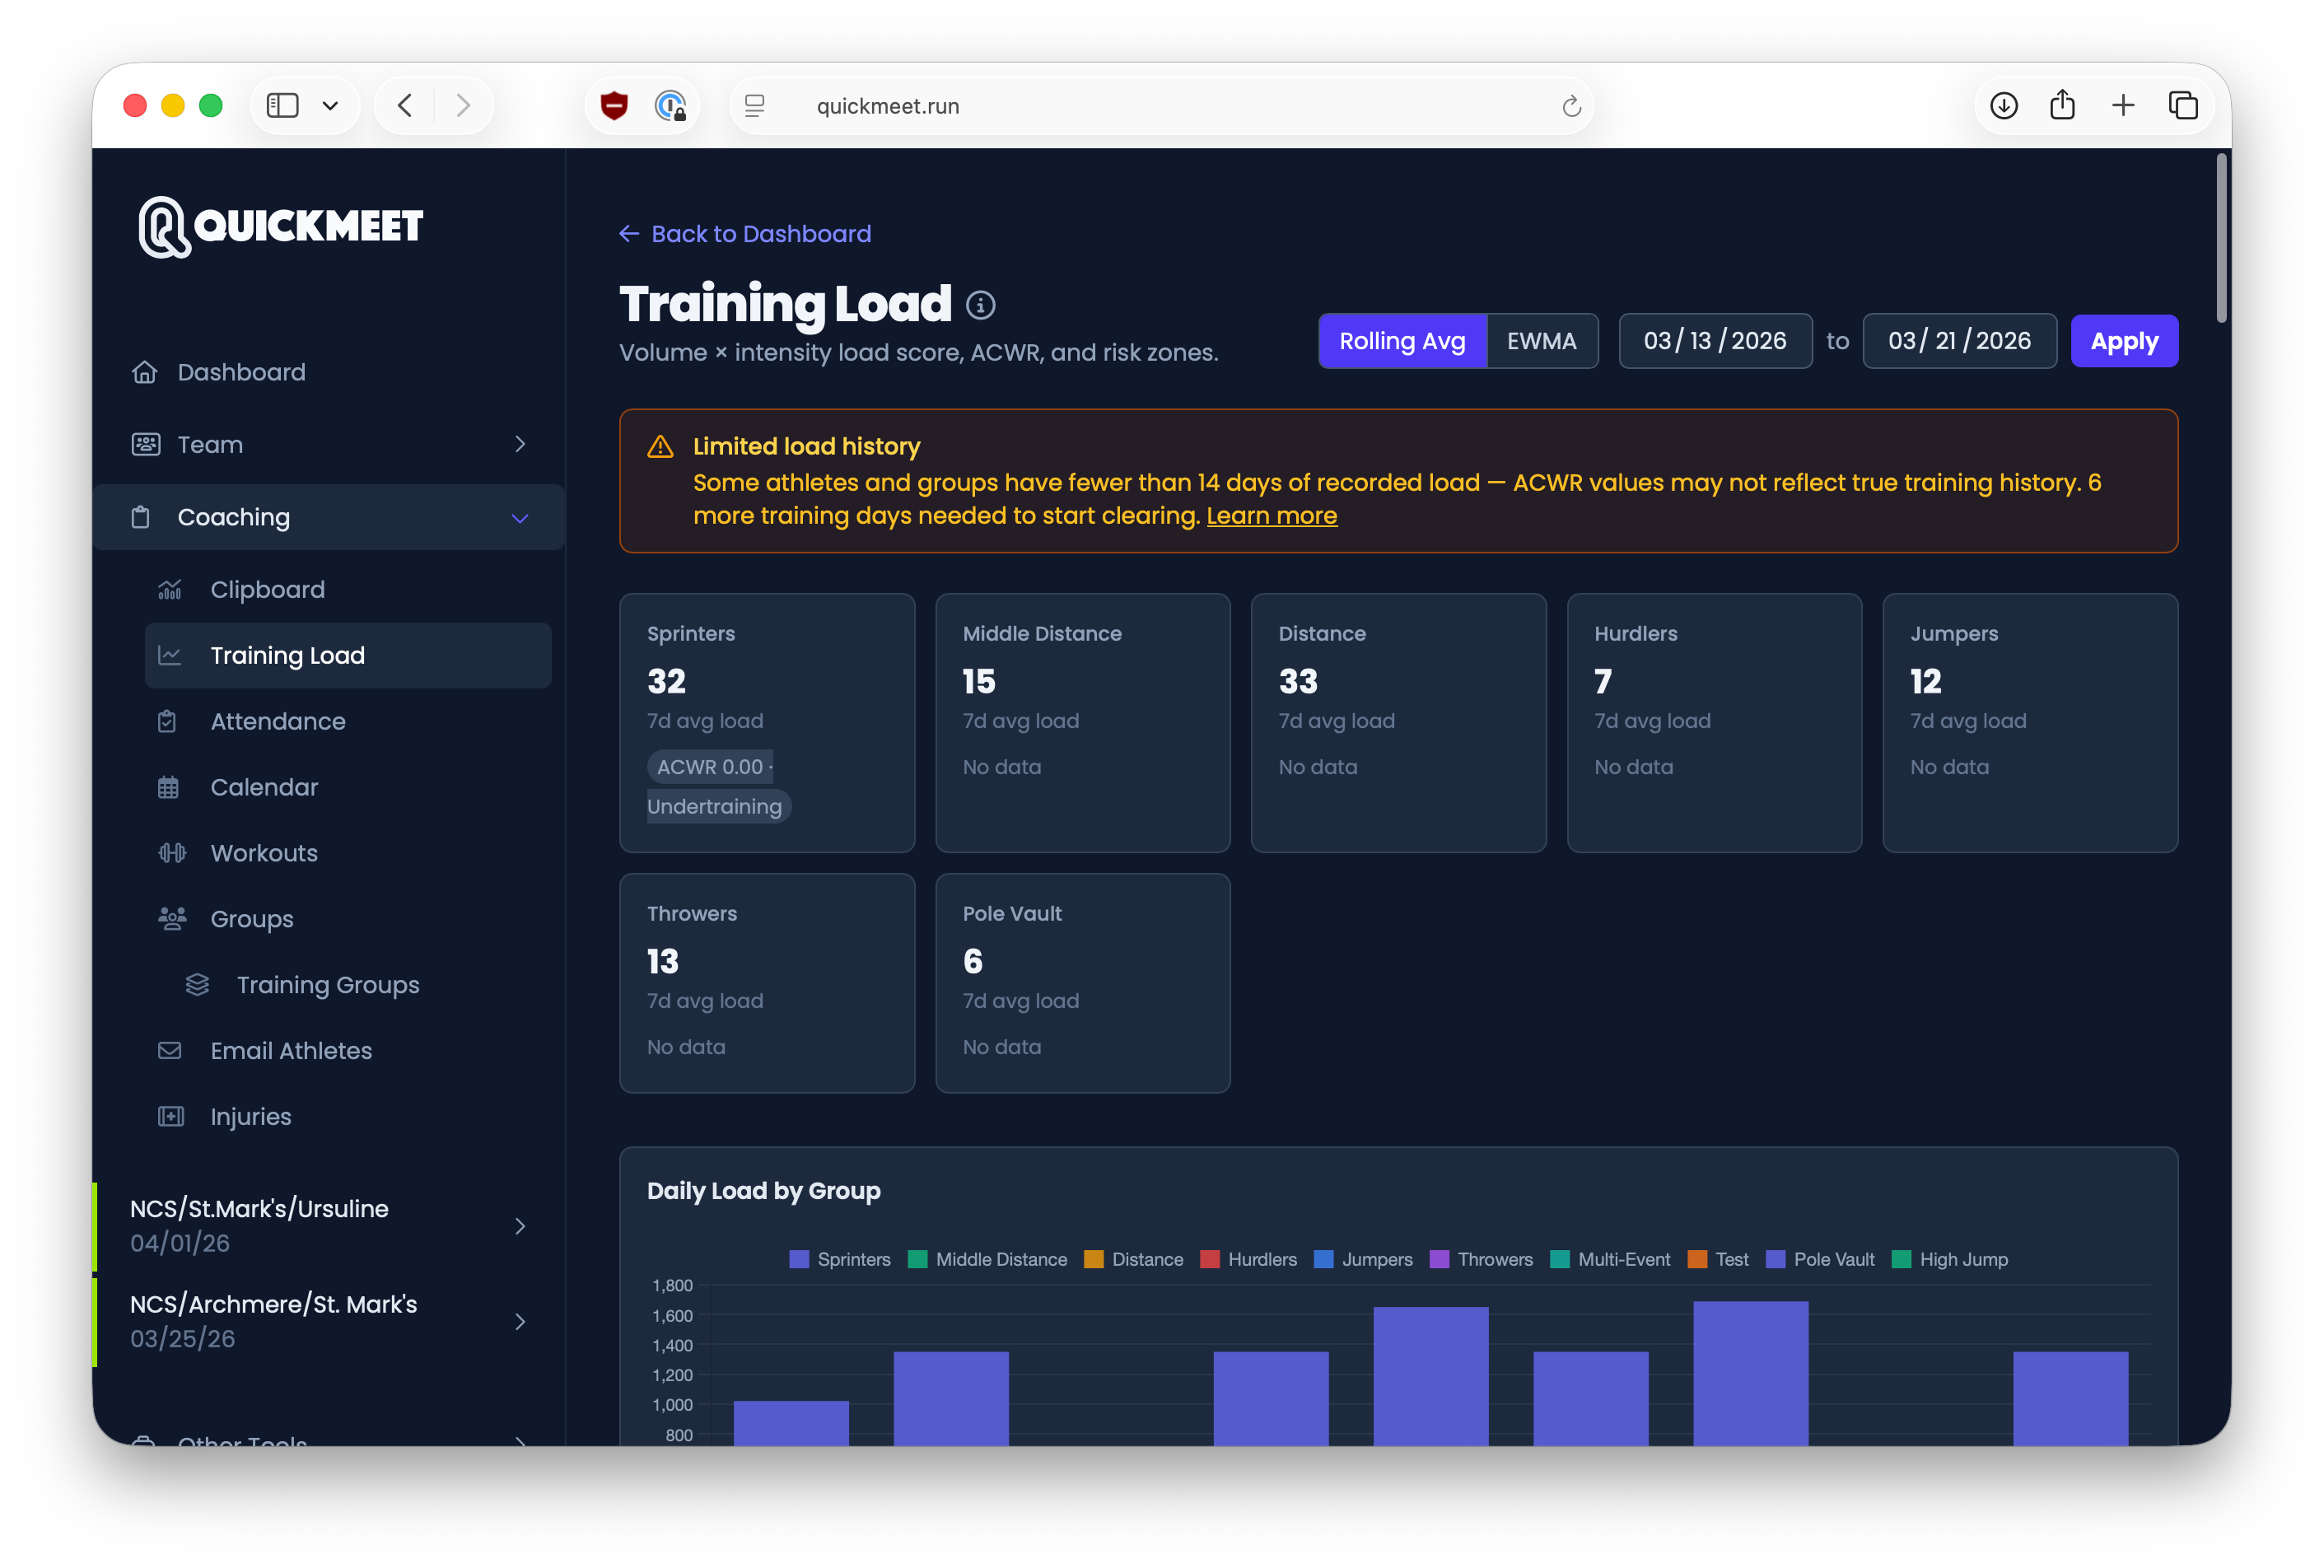
Training Load turns the workouts you log into an objective picture of how much work each athlete and group is doing — and flags when that work is ramping up faster than the body can adapt.
What it is
Every workout item with a distance contributes a load score (volume × intensity). QuickMeet totals those scores per day, then computes the Acute:Chronic Workload Ratio (ACWR) — recent load (about 7 days) compared to baseline load (about 28 days) — and sorts each athlete and group into a color-coded risk zone.
Reading the risk zones
ACWR is grouped into four zones:
- Undertraining (below 0.8) — recent load is well under baseline; fitness may be slipping.
- Optimal (0.8–1.3) — the healthy sweet spot, with the lowest injury risk.
- Caution (1.3–1.5) — ramping faster than the body is adapting; ease off or hold steady.
- High risk (above 1.5) — a sharp load spike and elevated injury risk.
Switching models & date range
Two controls at the top let you tailor the view:
- Rolling Avg vs EWMA — Rolling uses simple 7- and 28-day averages; EWMA weights recent days more heavily and is common in sports science. Toggle between them to compare.
- Date range — set the start and end dates to focus the chart and athlete table on a specific block (a build phase, a championship taper, and so on).
You need at least 7 days of data to calculate ACWR.
I hope you give it a try. Remember QuickMeet is free for everyone all summer long.
Enjoy your weekend!
Pat